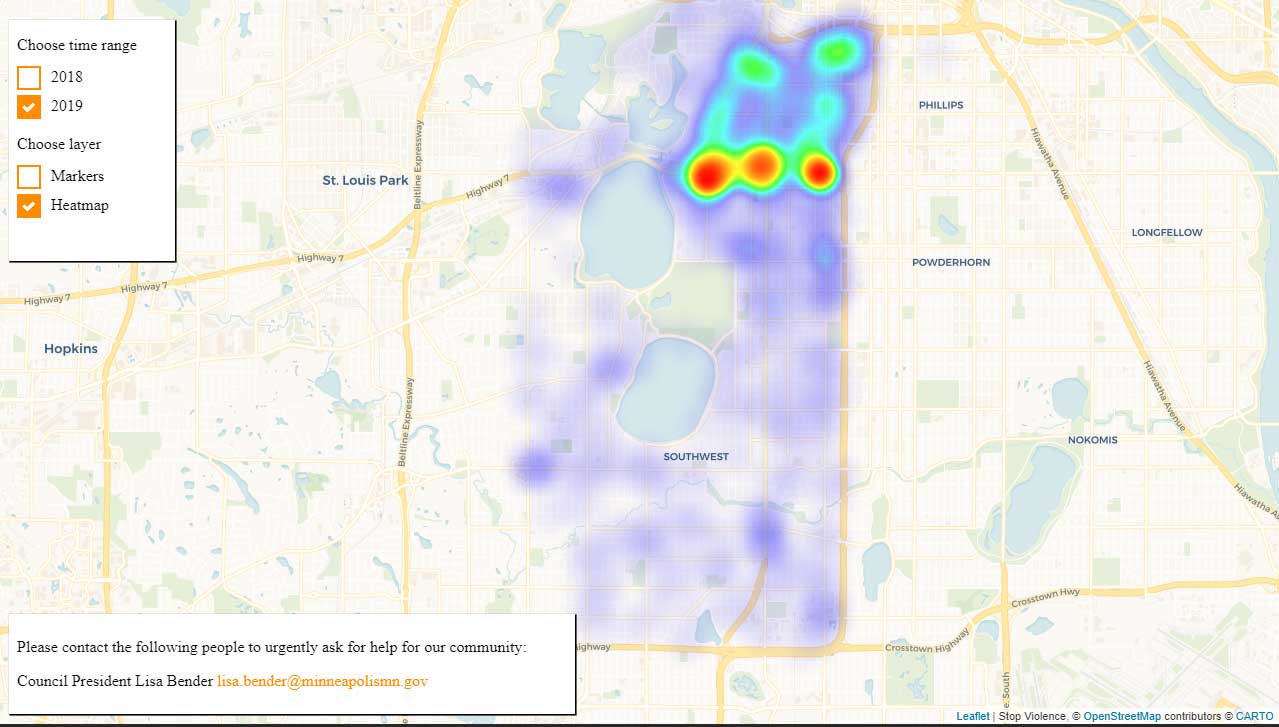
App was created to show the crimes distribution in Minneapolis by the type and year of occurence.
I used Leaflet to parse markers with appriopriate information and display data on the map. There is an option to generate the heatmap which shows clearly how the violence incidents are distributed over the city.
To generate the heatmap I used leaflet plugin - leaflet-heatmap.js. Data was provided by the official Minneapolis spatial geographic information systems portal.